1. BACKGROUND
1.1 Commercial Refrigeration System Description
The subject was a 14-year-old commercial refrigeration system which supported four (4) cold rooms in total: two (2) storage rooms; one (1) working room and; one (1) packaging room. Redundancy was required to meet the required temperature tolerance of +/-5°C. Only one (1) train was required to meet the demands of the system. Mechanical, Electrical and Instrumentation equipment were not part of the scope of this project as these assets were included in the site reliability program. Table 1 lists the equipment which was in the scope of this project.
| Equipment Type | Qty. | Function | Skid | Qty. Required |
|---|---|---|---|---|
| Shell/Tube Exch. | 2 | Condenser | Evaporator | 1 |
| Pressure Vessel | 2 | Low Temp. Suction Accumulator | Evaporator | 1 |
| Pressure Vessel | 2 | Medium Temp. Suction Accumulator | Evaporator | 1 |
| Pressure Vessel | 2 | Liquid Transfer Vessel | Evaporator | 1 |
| Pressure Vessel | 2 | High Pressure Receiver | Evaporator | 1 |
| Pressure Vessel | 2 | Filter/Dryer | Evaporator | 1 |
| Pressure Vessel | 2 | De-Superheater | Evaporator | 1 |
| Shell/Tube Exch. | 5 | Oil Cooler | Compression | 2 |
| Pressure Vessel | 5 | Oil Separator | Compression | 2 |
| Coil Exchanger | 4 | -35°C Evaporator | 2 | |
| Coil Exchanger | 14 | +5°C Evaporator | 7 | |
| Piping Circuit | 7 | Process, Insulated C/S | 7 | |
| Piping Circuit | 10 | Process, Un-Insulated C/S | 10 | |
| Tubing Circuit | 10 | Process, Copper Tubing | 10 | |
| Piping Circuit | 4 | Cooling Water, Un-Insulated C/S | 4 | |
| Tubing Circuit | 2 | Cooling Water, Copper Tubing | 2 |
Table 1. Project Scope: Equipment Listing
1.2 Challenges Faced
The value of the product stored in the storage rooms was in excess of $50 million. Any breach of tolerance beyond a defined time period required destruction of the product.
Asset compliance for fixed equipment was required by the state and not Process Safety Management (PSM). As a result, inspection history was only recorded to satisfy the regulatory requirement and was not used to predict asset integrity.
The design data was available from the original project files for the primary assets but not for all assets. Maintenance history was recorded for all assets in the system. Historically, the primary "bad actors" were piping and exchanger components in cooling water service.
1.3 Capital Investment to Improve Near Term Reliability
The client was planning to build a new facility but needed to keep the existing facility in reliable operation until the new facility could be brought on-line. Capital funding was dedicated to improve the near-term reliability of the existing system. Due to the lack of asset integrity history, the client needed a method for identifying which assets required replacement or repair and which assets would sustain the expected run-time without additional maintenance.
2. BENEFITS OF RBI
2.1 Risk Based Inspection (RBI) basics
RBI is defined as "a risk assessment and management process that is focused on loss of containment of pressurized equipment in processing facilities, due to material deterioration. These risks are managed primarily through equipment inspection." (1)
The probability of failure (POF) and consequence of failure (COF) are calculated individually and the product is the risk. Note that "failure" is defined as loss of containment.
The level of detailed information required to calculate risk can vary depending on the methodology applied. There are three types of methodologies used in industry today: Qualitative, Quantitative and Semi-quantitative. Regardless of the type of methodology chosen, the application of a documented and consistent approach that properly uses relative risk to support the needs will determine the success. The primary output of an RBI assessment is a mitigation plan.
2.2 Qualitative Methodologies
Qualitative methodologies tend to focus on engineering judgement, subject matter expertise and experience for calculating POF and/or COF. The primary benefit of this approach is that they are less costly as they do not require proprietary software or discreet data. The downside is that this approach is less precise than the other methods.
2.3 Quantitative Methodologies
Quantitative methodologies are model-based approaches using discreet data to calculate numerical values for POF, COF and, consequently, risk. This is the most precise methodology and is excellent for the long-term management of assets. This approach typically requires proprietary software program(s) and accurate data from multiple sources (maintenance, inspection, production, engineering and management). Many consider a quantitative methodology as too rigorous for the prioritization of inspection tasks.
2.4 Semi-quantitative Methodologies
Semi-quantitative models are a blend of the two (2) preceding methodologies. Proprietary software is typically used for this approach. The data required is typically less detailed than that of a quantitative approach.
3. PROJECT CHALLENGES
The initial challenges affecting this project were the limitation of funding and resources, no site endorsed methodology and no software license to use.
- Funding was at a minimum as this project was to precede and support the front-end loading (FEL) of the capital project. The funds allotted for the risk assessment could support approximately 160 hours of consulting time.
- Site resources were available to assist the project.
- The client chose to perform a qualitative RBI assessment to identify which equipment would require funding to achieve the reliability goals of the site.
4. RBI METHODOLOGY - EXCEL
A blended approach was proposed and accepted which used a semi-quantitative methodology for POF and a qualitative methodology for COF. Conservative assumptions were made and combined with field verification where required data was missing.
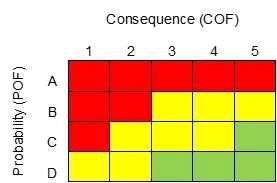
Risk was determined using a spreadsheet to calculate POF and COF. A non-standard 4x5 risk matrix was used with (4) POF categories (A through D) and five (5) COF categories (1-5). Three (3) color codes were used: Red=High; Yellow=Medium; Green=Low.

Figure 1. Non-standard Risk Matrix to Meet Site Standard
Damage rates were determined by researching all available records and consulting with site personnel. In the absence of accurate historical data, known values from similar service equipment were applied. A Corrosion Specialist was consulted to confirm/estimate rates based on operating conditions and metallurgy.
A qualitative damage mechanism named "Ice Damage" was assigned to the room evaporators. The evaporators had a history of freezing up due to high humidity year-round. This icing had to be manually removed using picks to clear the coils of ice. The evaporators in the -35°C storage room were assigned a 'B' probability for Ice Damage. The remaining evaporators operate in the +5°C rooms were assigned a 'D' probability for Ice Damage.
For corrosion under insulation (CUI), a corrosion rate of 0.010"/year was used for all insulated, carbon steel components.
4.1 Probablity of Failure (POF) Semi-quantitative methodology
POF was determined by estimating the remaining life (RL) of each component based on the following criteria: A=less than 1 year; B=1 to less than 5 years; C=5 to less than 10 years; D=10 years or longer. For the evaporators, this POF designation was then compared to the Ice Damage mechanism and the more conservative value was used for final POF.
The first step for estimating RL was to determine the minimum thickness required (tmin) for each component. The minimum thickness required for pressure (Ptmin) was calculated using ASME code formulae for circumferential (hoop) stress. ASME BPVC Section VIII, Division I was used for the fixed equipment while ASME B31.3, Process Piping was used for piping.
Structural minimum thickness (Stmin) was assigned as follows:
- Tubing=20% of nominal thickness
- Fixed equipment and piping >=2" diameter=0.125"
- Piping < 2" diameter=0.100"
- De-superheater Plates=30% of nominal thickness
Ptmin was then compared to Stmin and the greater value was used as tmin for further calculation.
The internal (CRint) and external (CRext) corrosion rates were combined (CRtotal) and multiplied by the life of the asset to determine the total estimated wall loss. This loss was subtracted from the nominal thickness to provide the current estimated thickness (tactual). Finally, the remaining life estimate was calculated by the following formula: (tactual - tmin) / CRtotal=RL
4.2 Consequence of Failure (COF) Qualitative Methodology
COF was determined using site resources to evaluate each component on four (4) independent consequence categories: Safety Impact; Environmental Impact; System Operability Impact; Storage Room Operability Impact. Five (5) severity levels were identified from 1 (High-High) to 5 (Low). Once tabulated, the category with the highest severity (or lowest number) was used to represent the component.
5. PROJECT PLAN AND PROGRESSION

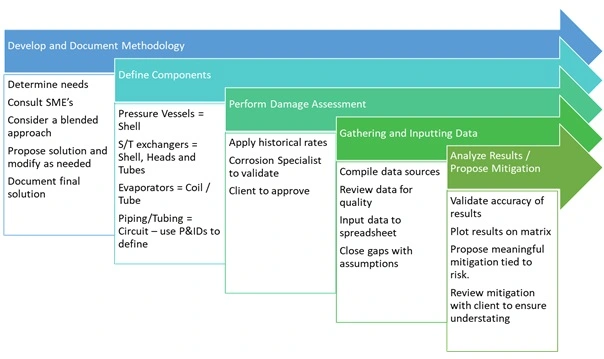
Figure 2. Project Plan and Progression
5.1 Develop and Document the Methodology
The methodology defined above was developed with the client to fit a specific purpose. This included on-site meetings and interviews with site resources. The equipment locations and data were also reviewed to better understand the needs and capabilities. Site subject matter experts (SME) were instrumental in defining the COF severity levels and categorizing damage levels associated with "Ice Damage". This methodology was documented to show transparency of a consistent application and provide for future reference.
5.2 Define Components
The fixed equipment was broken into major components, as follows:
- Pressure vessels were assigned one (1) shell component.
- Shell and tube heat exchangers were assigned three (3) components: shell, head and bundle.
- Room evaporators were assigned one (1) tubing component.
- Piping components were defined using the piping and instrumentation drawings (P&IDs). The line numbers were used to identify each component.
5.3 Perform Damage Assessment
All damage values were assigned per the methodology defined above. After the Corrosion Specialist validated and the client approved these values, they were entered into the POF spreadsheet for risk calculation.
5.4 Gathering and inputting data
Site resources were responsible for compiling the data sources needed for the project. Once completed, the project team reviewed the data, then input the required fields into the risk calculation spreadsheet. Where data gaps were discovered, field verification was employed to determine the best conservative assumption.
5.5 Analyze Results and propose mitigation
Once risk was calculated for all components, the methodology was verified for accuracy. The risk results for each component were plotted on the risk matrix (see figures 2-4) and the initial mitigation plans were drafted for client review. The mitigation groupings were designed to fit the client's needs and original purpose of the assessment:
- Inspect high-risk equipment immediately to quantify damage estimates and determine repair/replacement plan.
- Replace equipment based on historical life expectancies.
- Propose damage preventions to extend the life of assets.
- Inspect remaining assets to quantify damage estimates.
The mitigation plans were reviewed with the client detailing the justification of each asset based on the methodology.
6. RESULTS
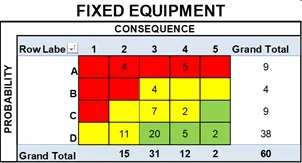
The results of this risk assessment identified the primary issues affecting the longevity and reliability of this refrigeration system's fixed equipment assets were CUI and cooling water related corrosion. The following matrices in figures 3 and 4 show the risk distribution as a result of this assessment.

Figure 3. Risk Distribution, All Equipment Components


Figure 4. Risk Distribution, Fixed and Piping/Tubing Components
Based on the results of this assessment, the following mitigation actions were recommended:
- The following equipment should immediately have the insulation stripped for inspection with expected repairs or replacement due to CUI:
- The Low and Medium Temperature Suction Accumulators (A-2)
- The Liquid Transfer Vessels (C-3)
- Carbon Steel Piping
- Three (3) circuits (A-3)
- One (1) circuit (B-3)
- Three (3) circuits (C-3)
- All (5) Compressor Oil Coolers (A-4 & C-3) should be replaced in kind immediately due to water side corrosion.
- The channel heads on the condenser (C-4) should be removed and inspected to quantify water side corrosion rates and repaired and/or coated as required.
- Sacrificial anode installation should be added to limit corrosion damage of the heads and tubes.
- The four (4) Evaporators in the -35°C storage room should be replaced due to frequent icing affecting the long-term reliability of this equipment.
- Due to the high impact related to consequence, all (5) piping circuits (D-2) should be inspected in a high confidence manner to quantify the expected condition.
- The remaining equipment should be inspected to confirm the findings of this assessment, with priority placed on the higher risk equipment.
7. CONCLUSION
Refrigeration units or "skids" have commonly been managed independently of process equipment integrity programs. Some owner/operators often use special emphasis maintenance teams within the site to manage these assets independently of process related assets and others rely on third party maintenance providers. All too often, refrigeration skids fly under the radar of the site asset integrity program and are not given the same discretion as the process equipment.
This case study provides one example of how facilities can use the fundamentals of RBI to prioritize equipment using minimal effort and resources. The key to success in this approach is to focus the solution based on the specific needs of the facility and resist implementing an over-designed approach in order to minimize the overall effort.
Regulatory compliance is an everchanging target that operators must adjust to. Lessons learned from recent events make their way into our recognized and generally accepted good engineering practices (RAGAGEP). Systems that were once thought of as benign may suddenly become the focus for required asset integrity programs for compliance management. Using a qualitative, focused approach can help streamline the effort in defining which assets to implement into an existing asset integrity program and when.
REFERENCES
- API RP 580 "Risk Based Inspection", 3rd Edition, American Petroleum Institute, February 2016.


Publication Inquiry